Benchmark for 'Sequential read' operation
Chart
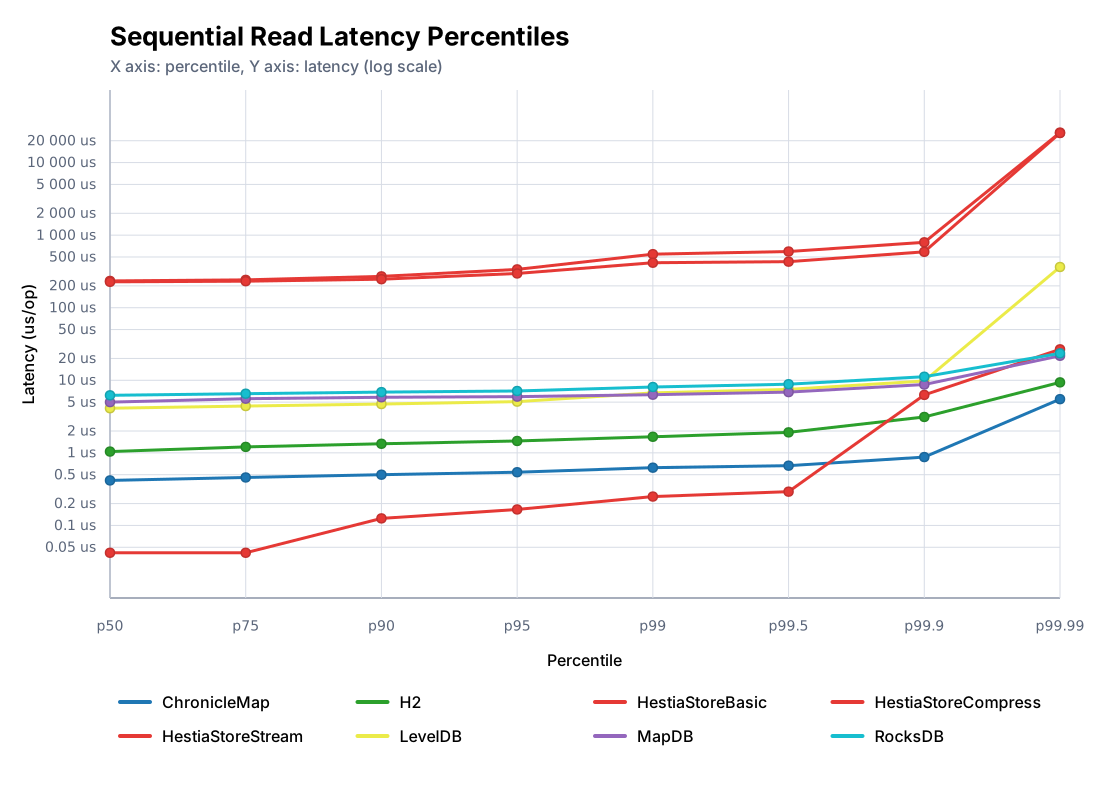
Percentile Chart
This chart shows the latency percentile curve for the benchmarked engines. The X axis runs from p50 to p99.99, and the Y axis uses a logarithmic latency scale so tail-latency differences are easier to compare.
Test Conditions - Sequential Read Benchmarks
- Each sequential scenario uses the same JVM flags, hardware, and scratch directory handling as the write/read suites. The
dirproperty is cleaned before every run to guarantee a fresh start. - Setup writes 10 000 000 deterministic key/value pairs (seed
324432L) into the engine. Keys are generated viaHashDataProviderso that the exact ordering is reproducible across runs. - After preloading, the benchmark resets its sequential cursor. Warm-up iterations walk the keyspace from the first key to the last key so caches and OS I/O buffers reflect streaming access.
- Each run exposes the same single-threaded sequential scan in two JMH modes:
SampleTimeto capture per-operation latency distribution andThroughputto capture sustained ordered-read performance. - The read workload remains single-threaded; each invocation issues exactly one lookup to keep measurements comparable with the other suites.
- Directories remain on disk after the run so disk usage and auxiliary metrics can be collected by reporting scripts.
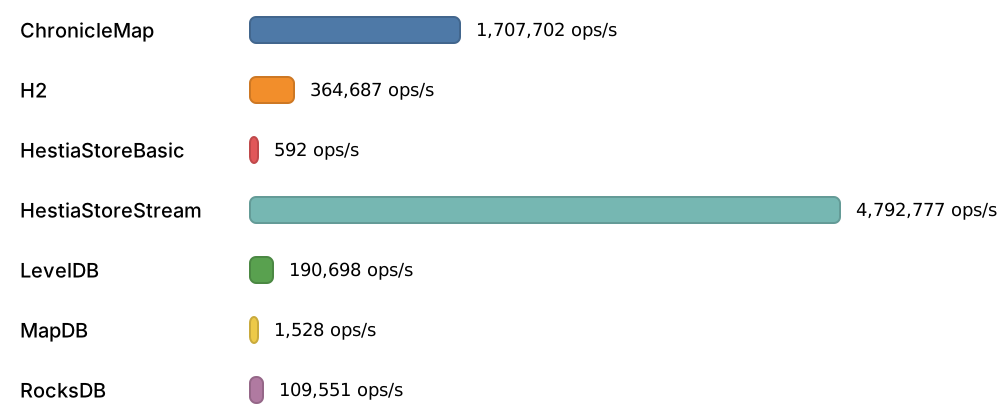
- Tests for HestiaStoreStream use dedicated stream API. Without using Stream API is performance visible in line HestiaStoreBasic.
- Tests executed on Mac mini 2024, 16 GB RAM, macOS 15.6.1 (24G90).
Data for Throughtput Chart
| Engine | Score [ops/s] | Mean [us/op] | p50 [us/op] | p95 [us/op] | p99 [us/op] | Occupied space | CPU Usage |
|---|---|---|---|---|---|---|---|
| ChronicleMap | 2 450 005 | 0.427 | 0.417 | 0.541 | 0.625 | 2.03 GB | 8% |
| H2 | 932 959 | 1.08 | 1.042 | 1.458 | 1.666 | 8 KB | 9% |
| HestiaStoreBasic | 4 507 | 220.263 | 256.768 | 288.768 | 542.72 | 549.56 MB | 18% |
| HestiaStoreCompress | 4 404 | 223.869 | 265.728 | 295.424 | 443.392 | 335.56 MB | 20% |
| HestiaStoreStream | 7 718 615 | 0.224 | 0.083 | 0.167 | 0.25 | 335.55 MB | 16% |
| LevelDB | 115 114 | 4.218 | 4.12 | 5.08 | 6.704 | 363.48 MB | 8% |
| MapDB | 192 769 | 5.157 | 5 | 5.952 | 6.328 | 1.3 GB | 6% |
| RocksDB | 163 819 | 6.118 | 6.208 | 7.12 | 8.08 | 324.24 MB | 8% |
Source Data for Percentile Chart
| Engine | p50 [us/op] | p75 [us/op] | p90 [us/op] | p95 [us/op] | p99 [us/op] | p99.5 [us/op] | p99.9 [us/op] | p99.99 [us/op] |
|---|---|---|---|---|---|---|---|---|
| ChronicleMap | 0.417 | 0.458 | 0.5 | 0.541 | 0.625 | 0.666 | 0.875 | 5.496 |
| H2 | 1.042 | 1.208 | 1.334 | 1.458 | 1.666 | 1.916 | 3.124 | 9.36 |
| HestiaStoreBasic | 256.768 | 261.12 | 269.824 | 288.768 | 542.72 | 552.96 | 635.904 | 23 199.744 |
| HestiaStoreCompress | 265.728 | 271.36 | 279.552 | 295.424 | 443.392 | 449.536 | 527.36 | 22 904.832 |
| HestiaStoreStream | 0.083 | 0.084 | 0.125 | 0.167 | 0.25 | 0.25 | 5.16 | 21.408 |
| LevelDB | 4.12 | 4.416 | 4.704 | 5.08 | 6.704 | 7.496 | 9.776 | 364.032 |
| MapDB | 5 | 5.576 | 5.832 | 5.952 | 6.328 | 6.872 | 8.736 | 21.771 |
| RocksDB | 6.208 | 6.536 | 6.872 | 7.12 | 8.08 | 8.832 | 11.2 | 23.52 |